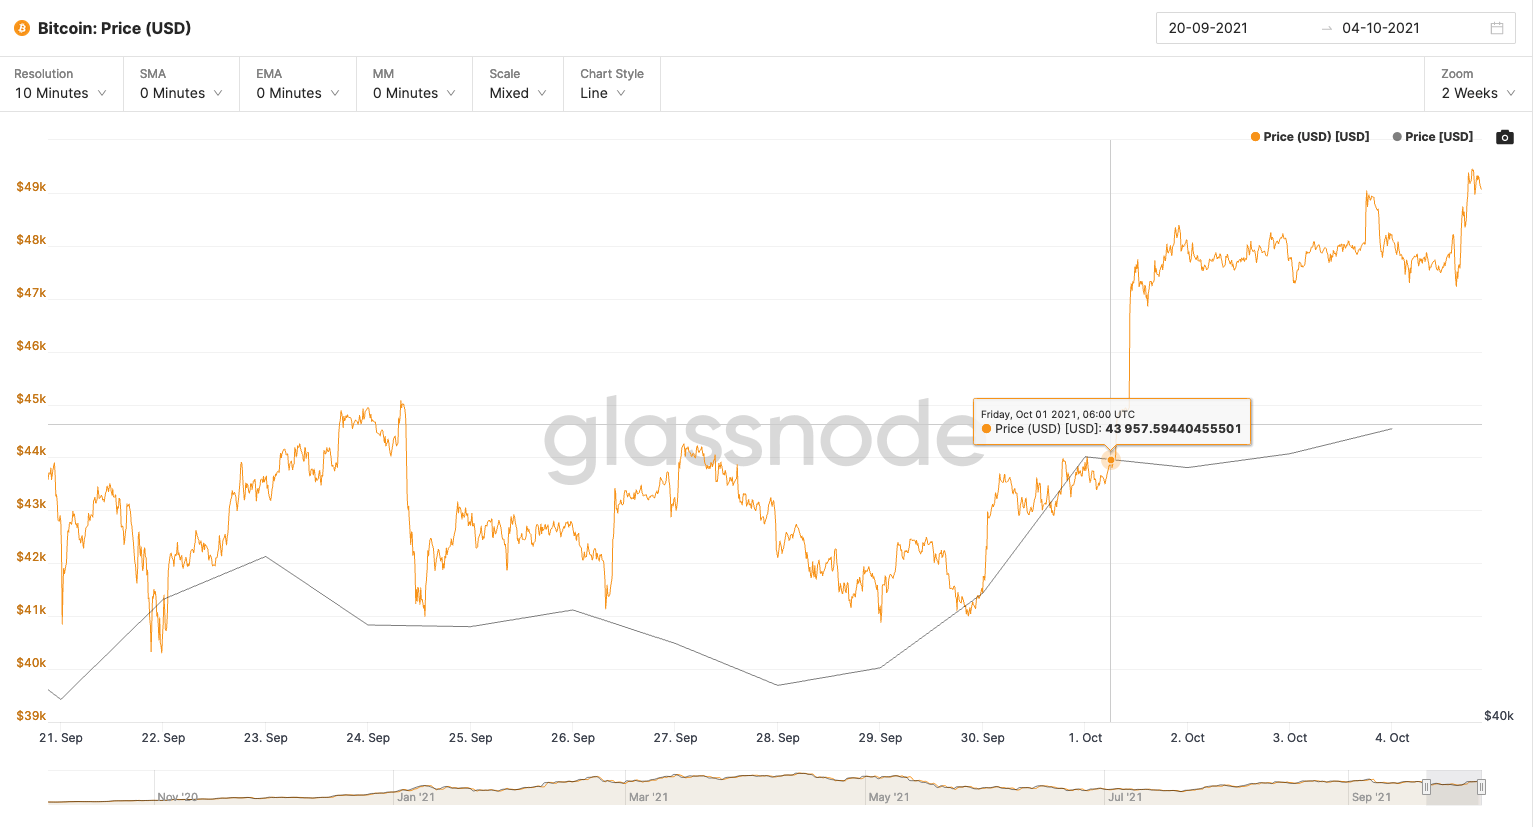
As forecasted in The On-Chain BTC Forecast: Week #38, the price of bitcoin was quite stable throughout the week but rumbled up by $4000 USD on Friday, 01 October 2021. Remarkably, the price gain happened in a period of around 30 minutes that morning. Thanks to our high-resolution data from Glassnode, we know exactly when the price jumped that morning–but the exact reasons may be hard to decipher.
Let’s get started.
As data junkies, we have to add stories to the data we are examining, and, we must do it in a way that provides us the most insight into that data. A story is a compass that guides the way we think about any chart, spreadsheet, or infographic that we see. By finding the right story we are in fact, tuning our compass to extract the signals from the data we examine.
How did Twitter influence the price of BTC this week?
The story this week might be as simple as looking at Twitter’s announcement of the new feature of users having the ability to tip users on the platform. The first and most obvious question that comes to mind is this: What is the impact of “tipping” on Twitter in regards to the price this week? Did Twitter’s announcement of using the Lightning Network really drive the price of BTC up? In this case, yes, there is a strong correlation to price and announcement.
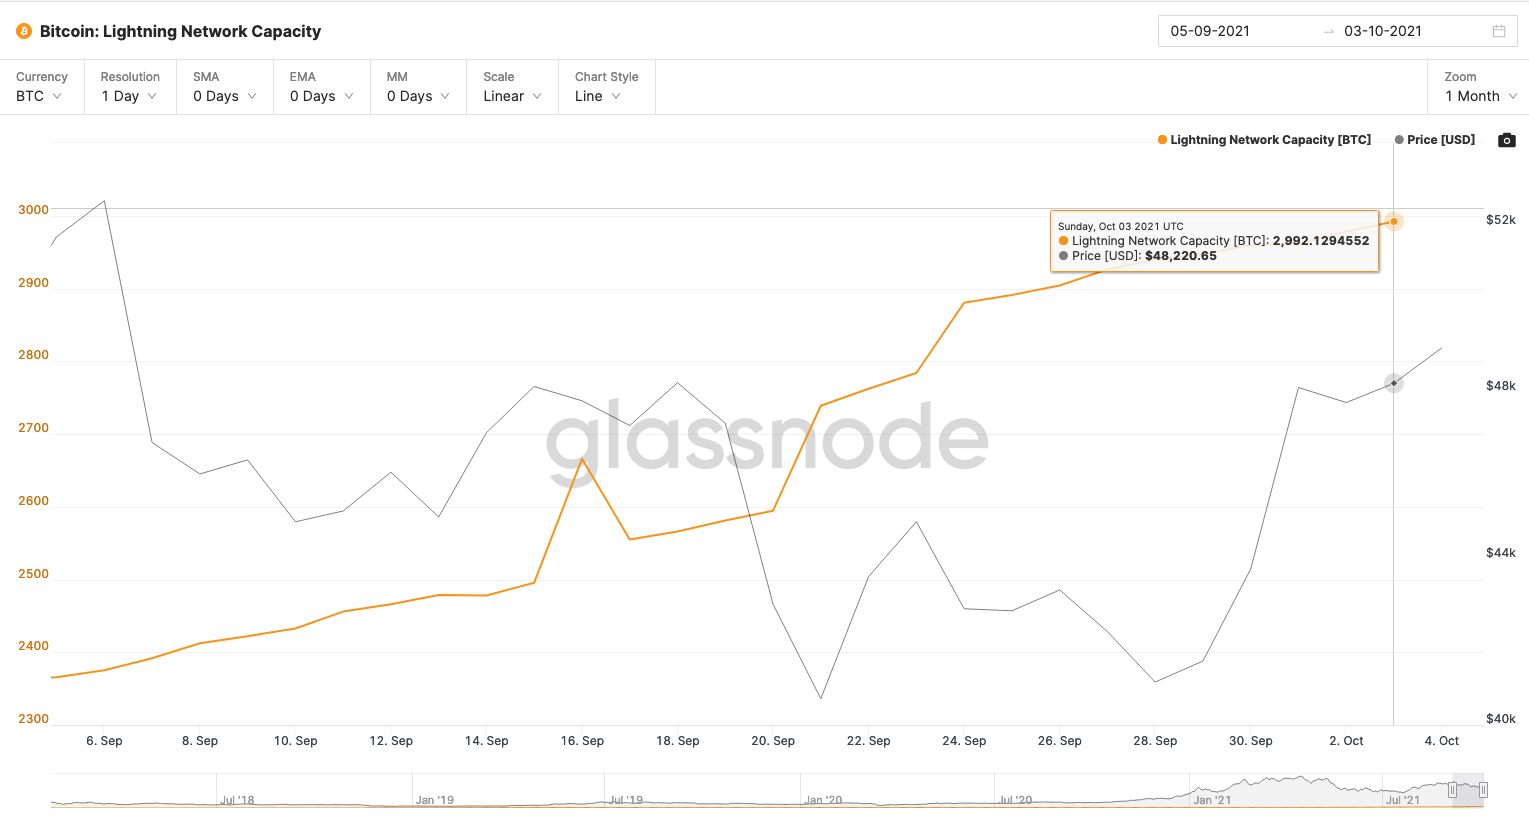
We can clearly connect the increase in capacity of the Lightning Network, BTC’s helpful payment processor enabled on Twitter, to the story about the price of Bitcoin rising thunderously as the effect of the Lightning Network struck on Friday morning. At the very least in the short run.

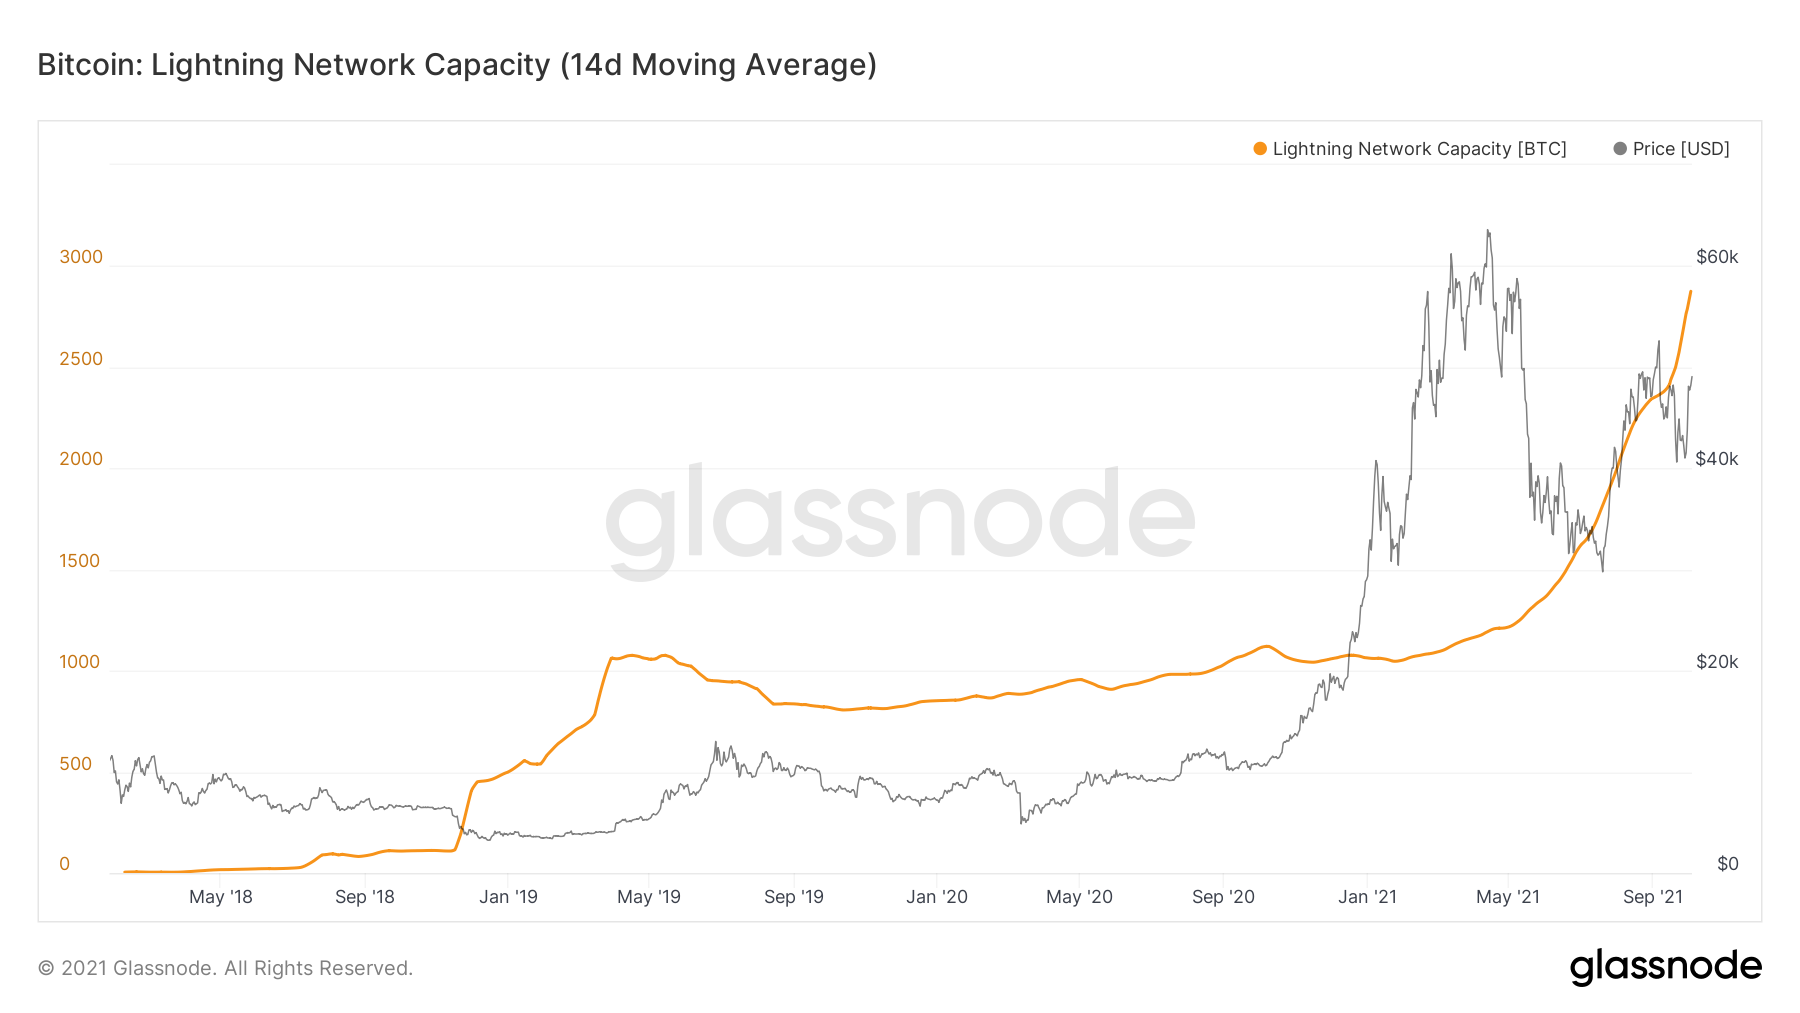
Zooming out over the last few weeks, and smoothing the data with a 14-day moving average, we can see a relationship with the price of BTC moving with the Lightning Network. The question is: As capacity increases, will the Lightning Network be an even stronger influence on the price of Bitcoin? Taking the macro-view and starting from the beginning of the Lightning Network in 2018, there is definitely a strong relationship between its growth and the price of BTC. We’ll be on the lookout as other platforms adopt similar abilities, and allow users to creatively use BTC in innovative ways.
What is BTC Liveliness?
Moving along, what are the other factors driving the price of BTC this week? Let’s look at the “Liveliness” of Bitcoin recently.
We like to examine the behaviors of the HODLers and one of the main benefits of the Bitcoin Blockchain is that we can see the exact number of BTC that every wallet has; we can also track how long someone is HODLing or not. This gives us a new metric called “Liveliness”, something that doesn’t exist in the equities markets.
Liveliness is a new metric that gives us the ability to track and measure the “HODLing” behaviors.
Whenever someone moves Bitcoins there is a record of that on the BTC blockchain. The blockchain, like a database, records the “time” the transaction happened (or height), the amount, and the wallets (the sources) of every Bitcoin involved, which also tells us how long the BTC has been held.
This is one of the amazing innovations of blockchain and BTC, these types of metrics in regards to traditional stocks, and how long a share is held, or who has held those specific shares is not possible in traditional financial markets.
With metrics like Liveliness, we can take a very objective look into how a BTC investor is acting and when–this can be an incredible tool as a qualitative measure.
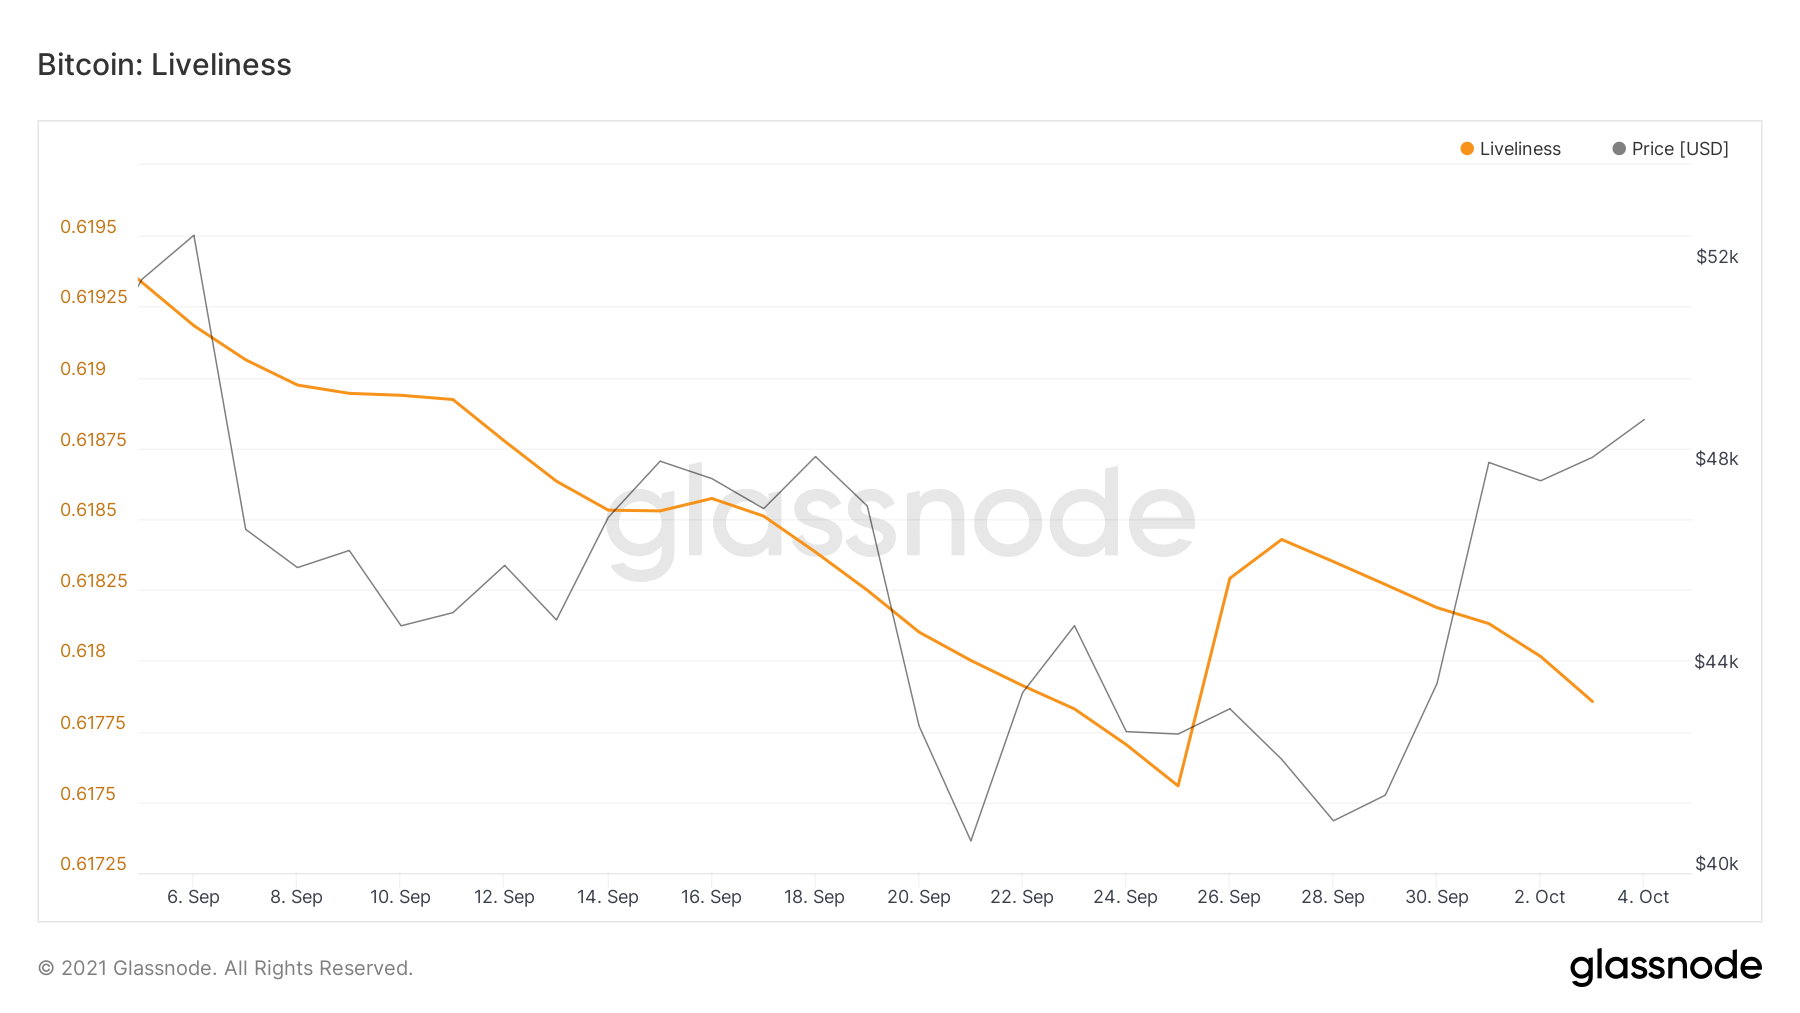
In the above chart, we can see liveliness dropping, then rising towards the end of the month, and again dropping down. The behavior that it shows is simply when long-term holders are holding or liquidating their holdings. As liveliness decreases, it tells us that HODLers are HODLing, or accumulating BTC. Conversely, as HODLers liquidate holdings, the value increases.
When we compare this to price movement, we must look at longer periods of time so that we can spot the trends that appear.

Looking at a month or two isn’t bad, but looking at longer time periods provides us with clearer insight when we are trying to find patterns. Here, looking at the last two years, we can see that towards the end of the year in 2020, HODLers began to accumulate coins, creating less liveliness in the markets mainly because of greater demand driven by fewer BTC coins available in the marketplace. This year seems to be following the same pattern.
Earlier in the year, HODLer’s sold into the market strength starting in the October and November months and rode the price as it rose to a new All-Time-Highs (ATH). We can deduce that we are currently in an accumulation cycle as HODLers gather or retain BTC, driving the price upward and onward to the next period of selling into the rising market. How long will this period last? If history repeats itself, we can assume that this holding and accumulation behavior will prevail for the next month or two, then later this year we can expect a large sell-off into strength as profits are taken.
Conclusion: BTC’s price will begin to climb as supply decreases and HODLer’s HODL.

Next week (and this week)
The forecast for BTC in week #40 looks promising. With the surprise gain last Friday, due to the Twitter expansion, it’s expected that we should see a bit of cooling down over the next couple of days as the price of BTC bumps along this latest plateau and gathers momentum for the potential expansion coming mid-late November.
Later this year
If we use the Liveliness metric detailed in this week’s forecast, the price future of BTC is looking incredibly promising. Basing our forecast on data from last year at the same time, the expectation is that HODLers will accumulate coins in the near term, restricting supply, and creating greater demand in the markets. As the market reacts in the same way it did last year, we will see the price increase to new highs in the upper 60s and 70s, especially if the current price remains relatively flat and we see greater capacity in platforms like the Lightning network.
Disclaimer
THE BTC NOW ON-CHAIN BTC FORECAST DOES NOT MAKE ANY EXPRESS OR IMPLIED WARRANTIES, REPRESENTATIONS, OR ENDORSEMENTS WHATSOEVER WITH REGARD TO THE NEWSLETTER. IN PARTICULAR, YOU AGREE THAT THE BTC NOW ON-CHAIN BTC FORECAST ASSUMES NO WARRANTY FOR THE CORRECTNESS, ACCURACY, AND COMPLETENESS OF THE NEWSLETTER.
YOU ARE SOLELY RESPONSIBLE FOR YOUR OWN INVESTMENT DECISIONS. WE ARE NEITHER LIABLE NOR RESPONSIBLE FOR ANY INJURY, LOSSES, OR DAMAGES ARISING IN CONNECTION WITH ANY INVESTMENT DECISION TAKEN OR MADE BY YOU BASED ON THE INFORMATION WE PROVIDE. NOTHING CONTAINED IN THE NEWSLETTER SHALL CONSTITUTE ANY TYPE OF INVESTMENT ADVICE OR RECOMMENDATION (I.E., RECOMMENDATIONS AS TO WHETHER OR NOT TO “BUY”, “SELL”, “HOLD”, OR TO ENTER OR NOT TO ENTER INTO ANY OTHER TRANSACTION INVOLVING ANY CRYPTOCURRENCY). ALL INFORMATION PROVIDED BY THE BTC NOW ON-CHAIN BTC FORECAST IS IMPERSONAL AND NOT TAILORED TO YOUR NEEDS.
BY USING THIS PUBLICATION, YOU ACKNOWLEDGE THESE DISCLAIMERS.