This week on-chain was a tough one to watch with the price of BTC dropping to the expected lower 40s suggested by last week’s prediction published by The On-Chain BTC Forecast: Week 37. This week looked strong out of the gate with prices surging momentarily on Saturday night, only to be left like Cinderella at the ball as the price turned to pumpkins and shriveled by 10,000 USD in the early Sunday morning hours.
Week #38 Major Takeaways
- How can we link stock market action to price movement in BTC? It’s difficult to find data and direct links between stocks and BTC therefore it’s difficult to objectively link price action with random events in the world at large.
- Where are we at in terms of larger cycles? Looking at metrics like the Puell Multiple, it’s fairly easy to see larger patterns in behavior as miners seek to find the best times to sell BTC. It looks as if we are at the bottom or nearing the bottom of a low Puell cycle.
- Are we ready for a bull run as illiquid assets grow? Clearly, illiquid and liquid BTC are heading in opposite directions with illiquid assets on the rise and liquid assets decreasing daily. Common sense tells us as an asset becomes more scarce, it’s value increases–if demand increases.
Social media reacted strongly and if nothing else there seems to be a direct positive relationship between the dropping price of BTC and the number of data charts and emojis that get squeezed into a tweet by every laser-eyed BTC bull monger. One must exercise caution when absorbing data that is explained with a 144 character short story rather than with the novel that BTC deserves.
Most on-chain experts quickly blamed the Evergrande situation for multiple failures, first in their failed forecasts and for the large dip in price; citing weak equities market action and an overall down week for most notable markets on-chain and off.
Sentiment overall was pensive and sullen, with some sources indicating, as usual, that a bullish move is indeed ahead for the burgeoning cryptocurrency, there does seem to be convincing trends to indeed signal a strong recovery in coming weeks even while it may take some time to develop.
How can we link stock market action to price movement in BTC?
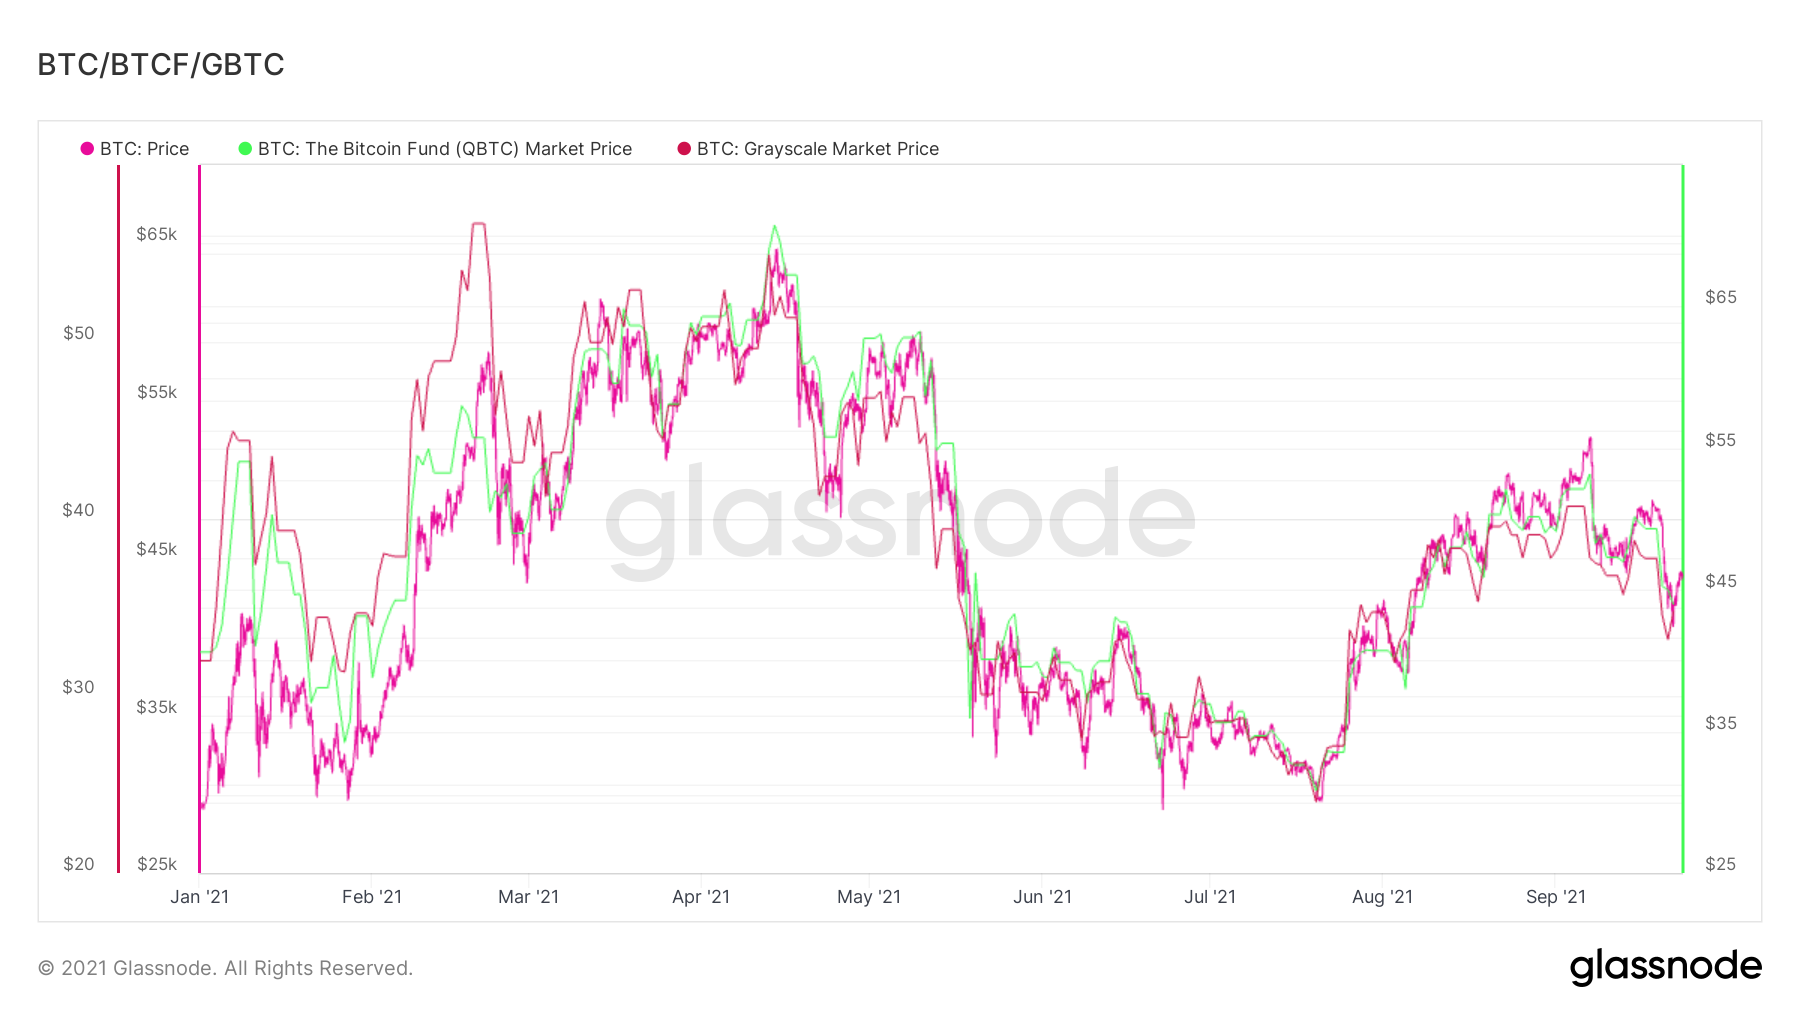
It’s difficult to make direct on-chain links, Looking at the stock prices of Grayscale and The Bitcoin Fund (ETF) we can see a closely linked relationship between the price of BTC and the respective equities, but understanding price movement this week in relation to Evergrande will be a hard connection to make.
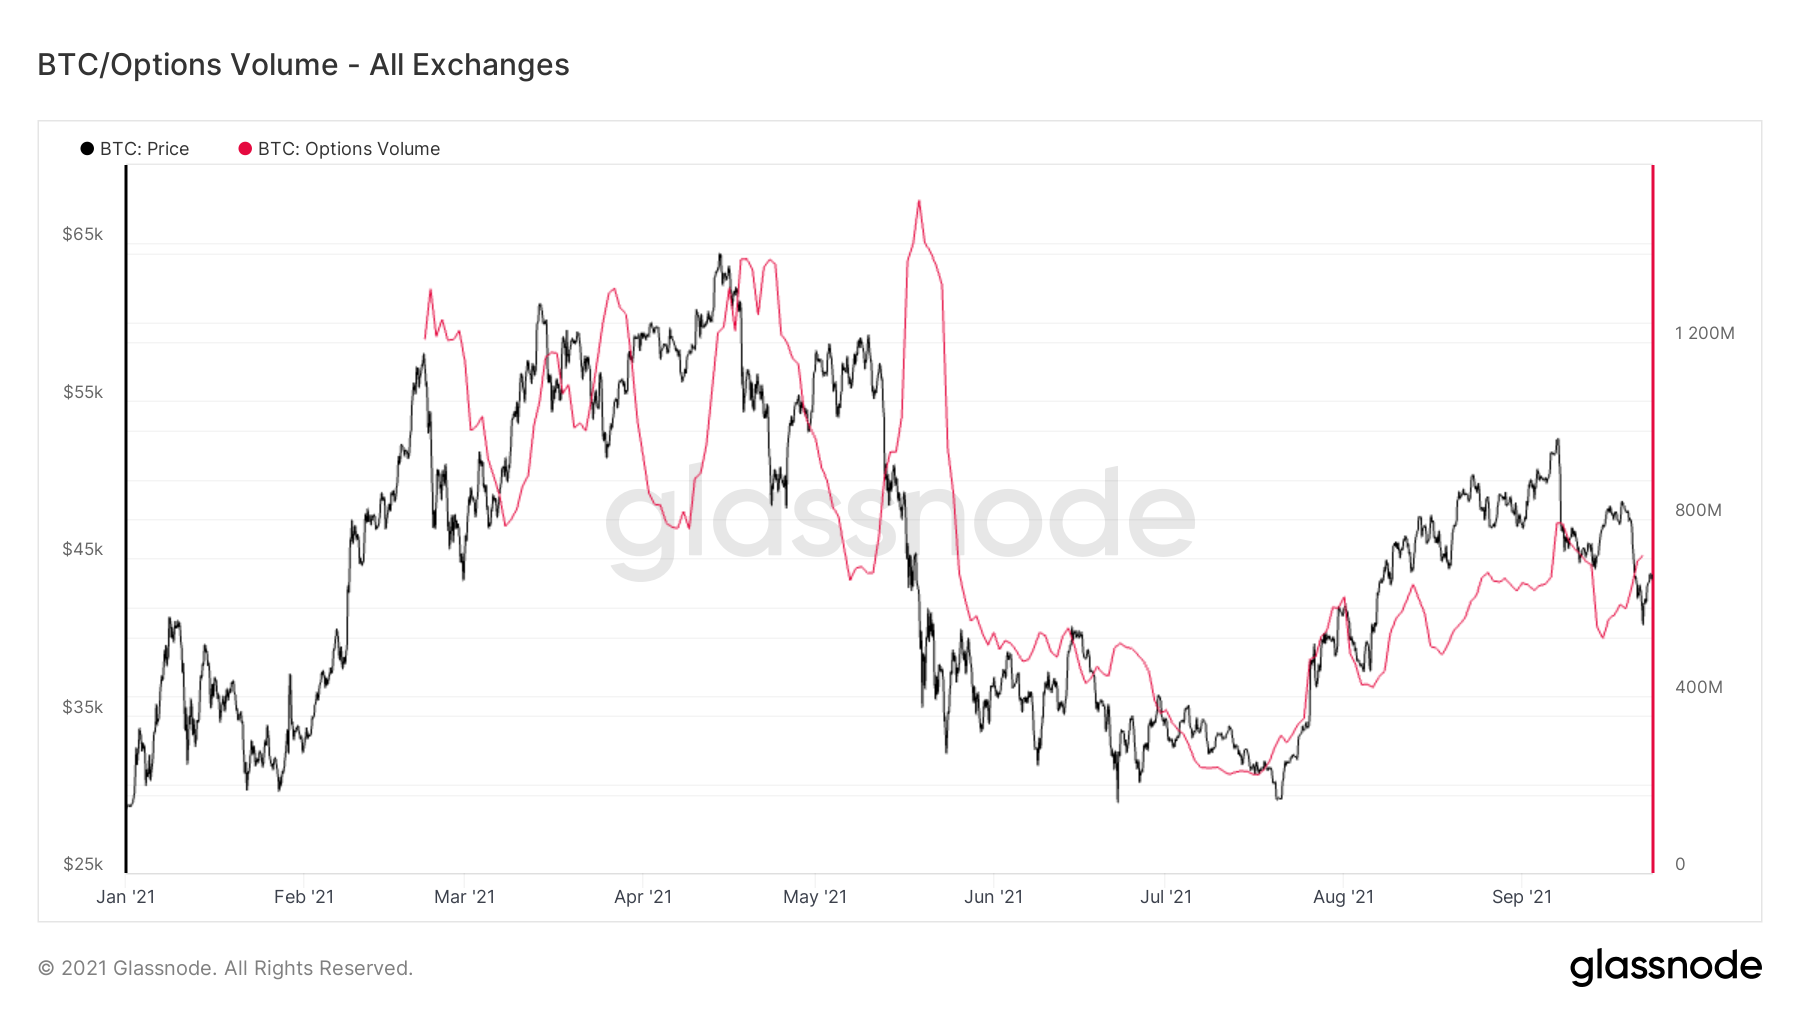
Options volumes are up this week and looking at the relationship between price and volume, it’s not perfectly clear as volume seems to have an inverse relationship to price during some periods and a direct relationship at other times. Although different than the equities market, it could provide some insight into investor sentiment.
Where are we at in terms of larger cycles?
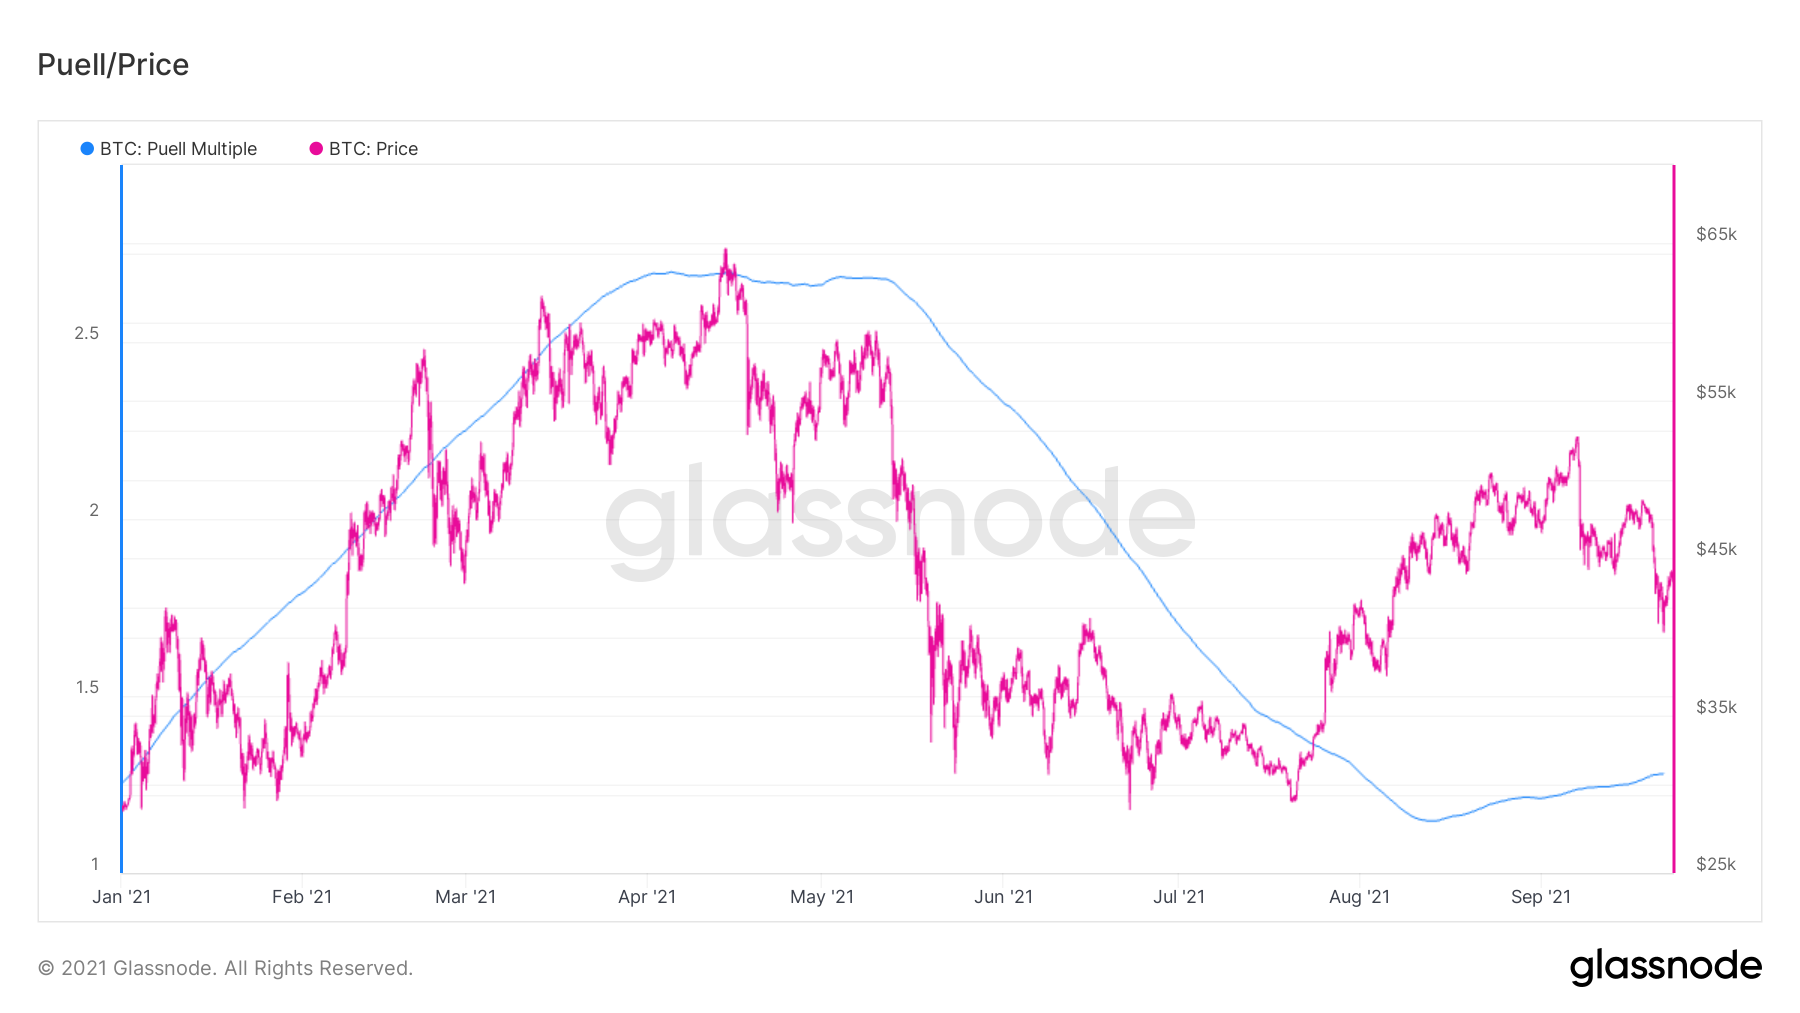
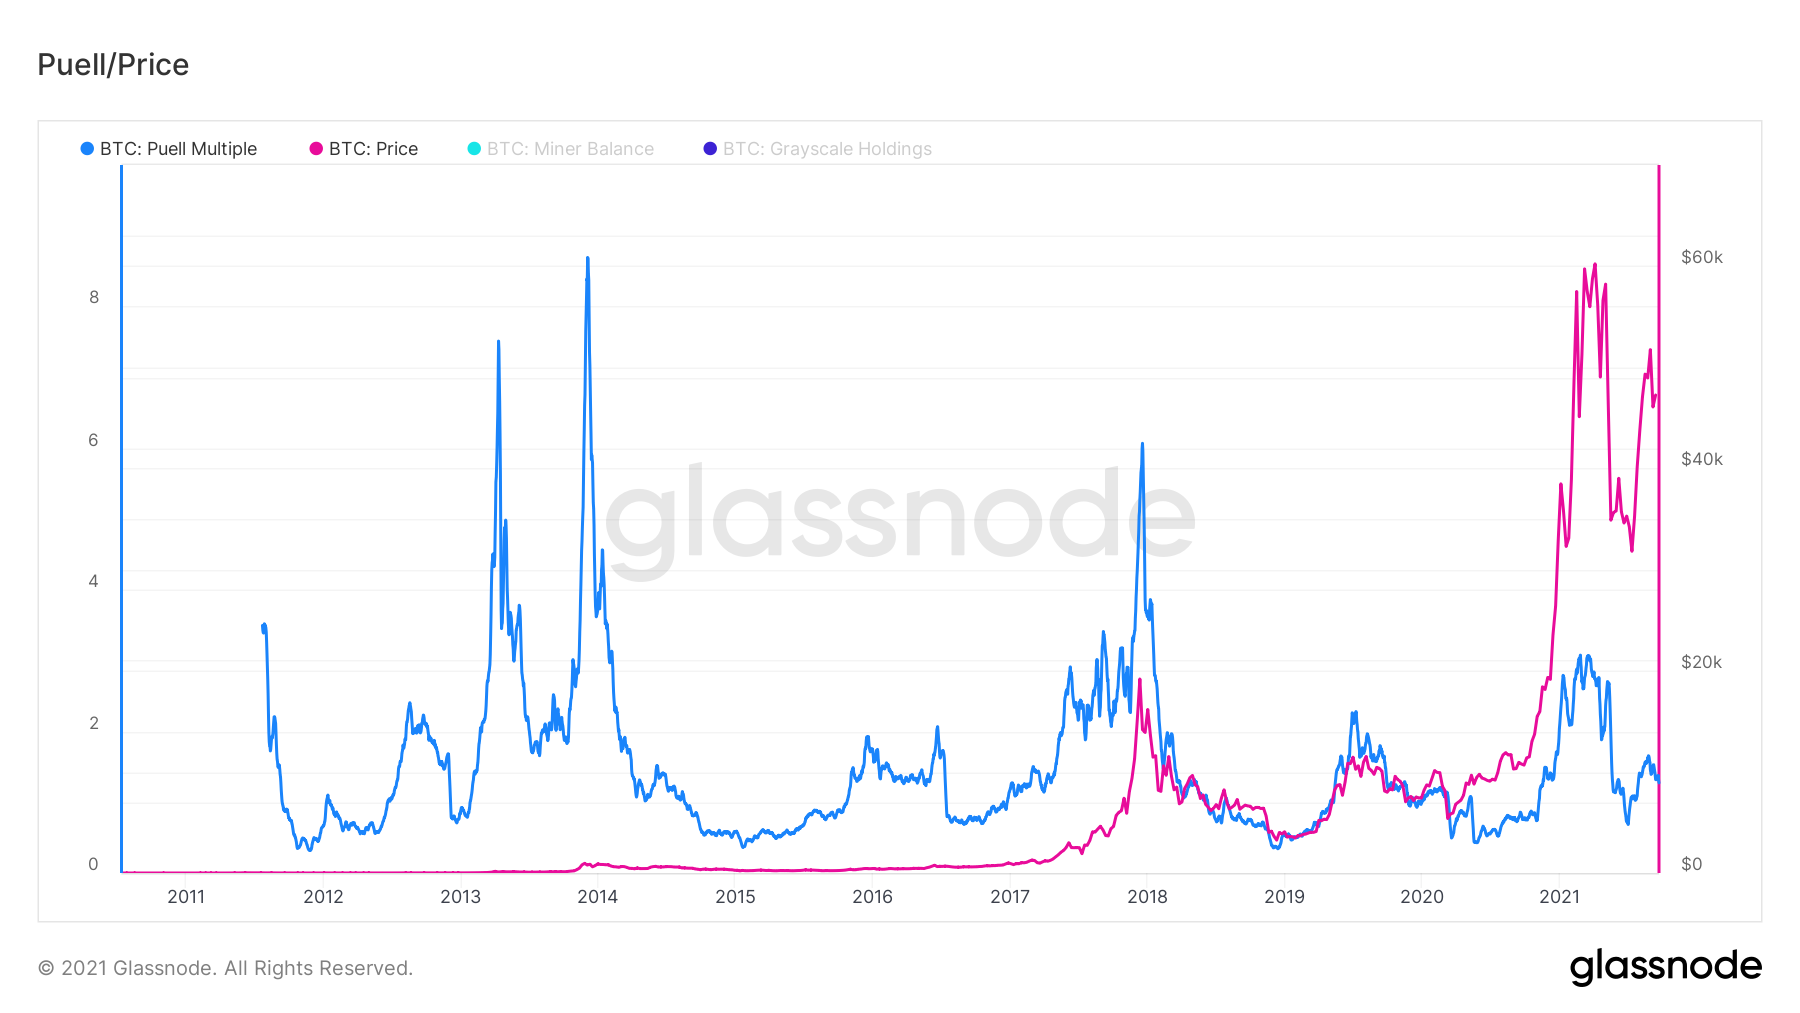
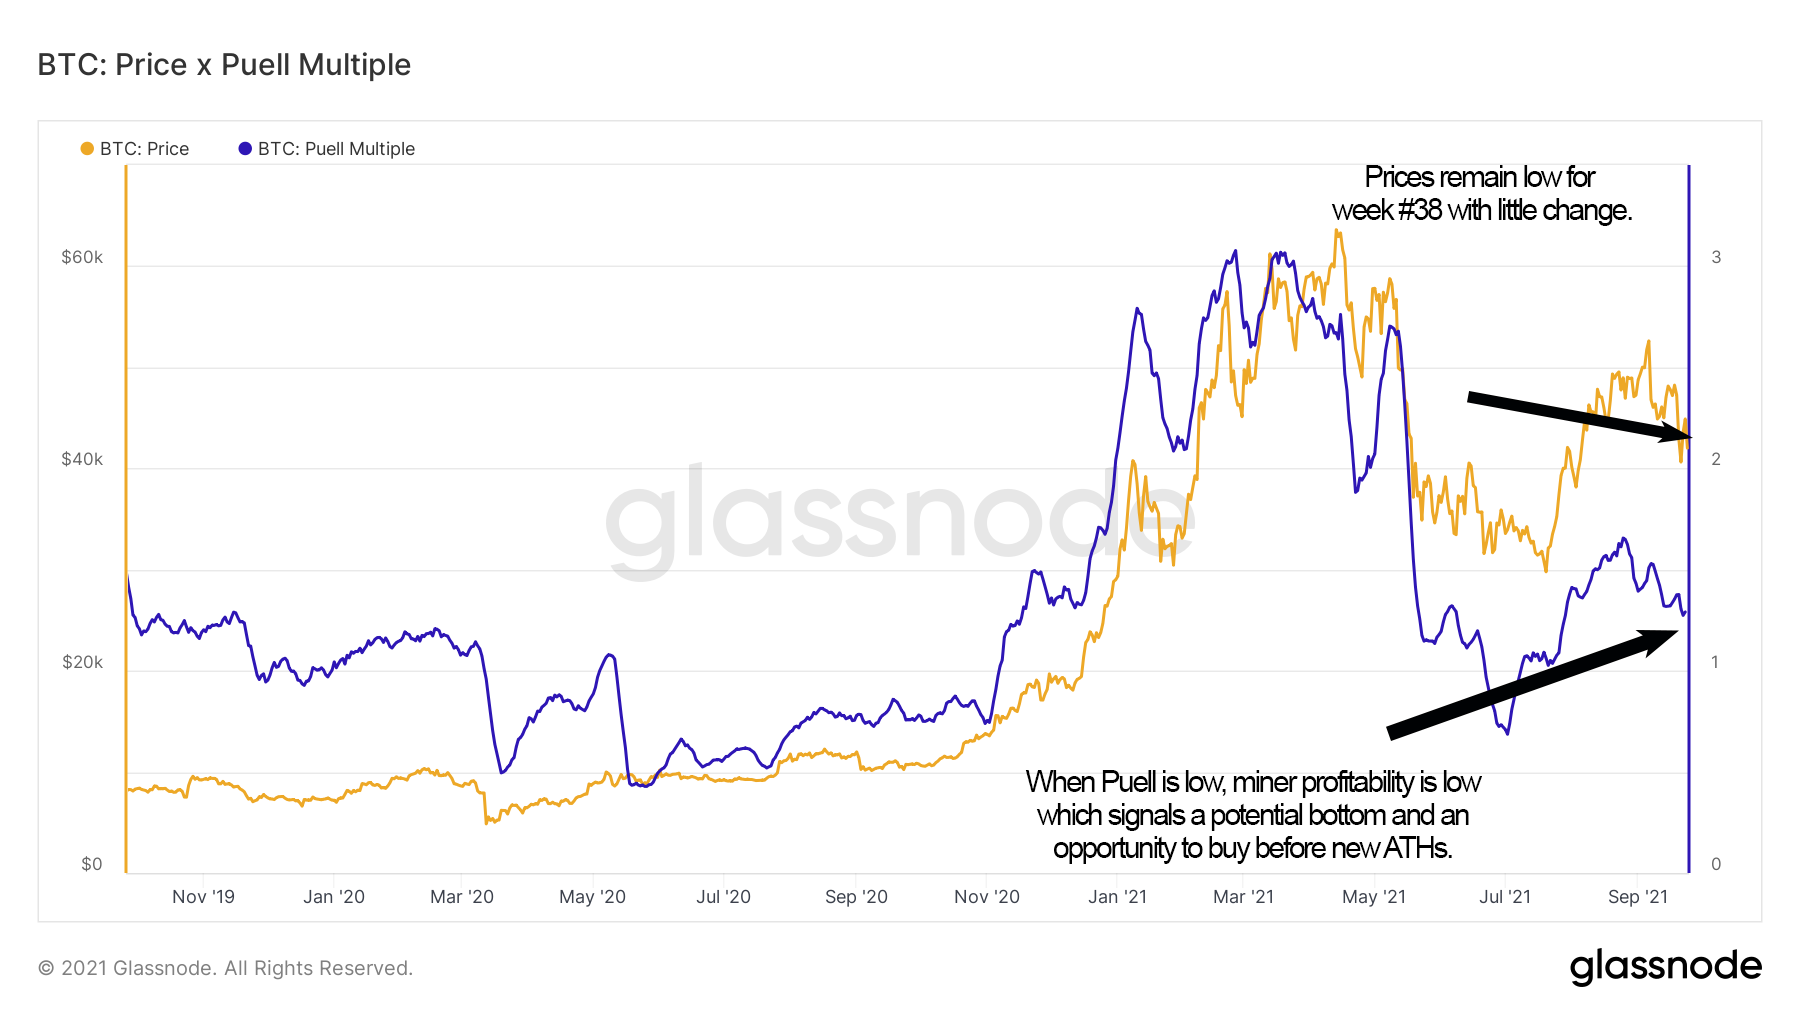
We find more clarity here. Using the Puell Multiple we can see how profitable a miner is compared to the rest of the year. We know that miners sell overtime to pay for fiat expenses and of course they’d rather sell fewer coins than more coins when paying the bills. Taking a macro view over the past five years, we can mark times when it’s been extremely profitable for miners to sell. The higher the Puell Multiple, the more miners are enticed to sell off into the market strength to take profits. Conversely, when Puell is low, miners begin to accumulate which lowers liquidity and signals an opportunity for others to buy coins as the price stabilizes prior to reaching new highs. It’s fairly obvious by looking at this metric that we are Puell is relatively low but not bottomed in this cycle. The question is whether it will continue on its upward trend or linger towards the downside as the price stagnates offering an opportunity to buy more BTC before it climbs.
This year’s data seems convincing and zooming out to three years of Puell/Price data the trend looks clear, the potential for price growth is clearly apparent.
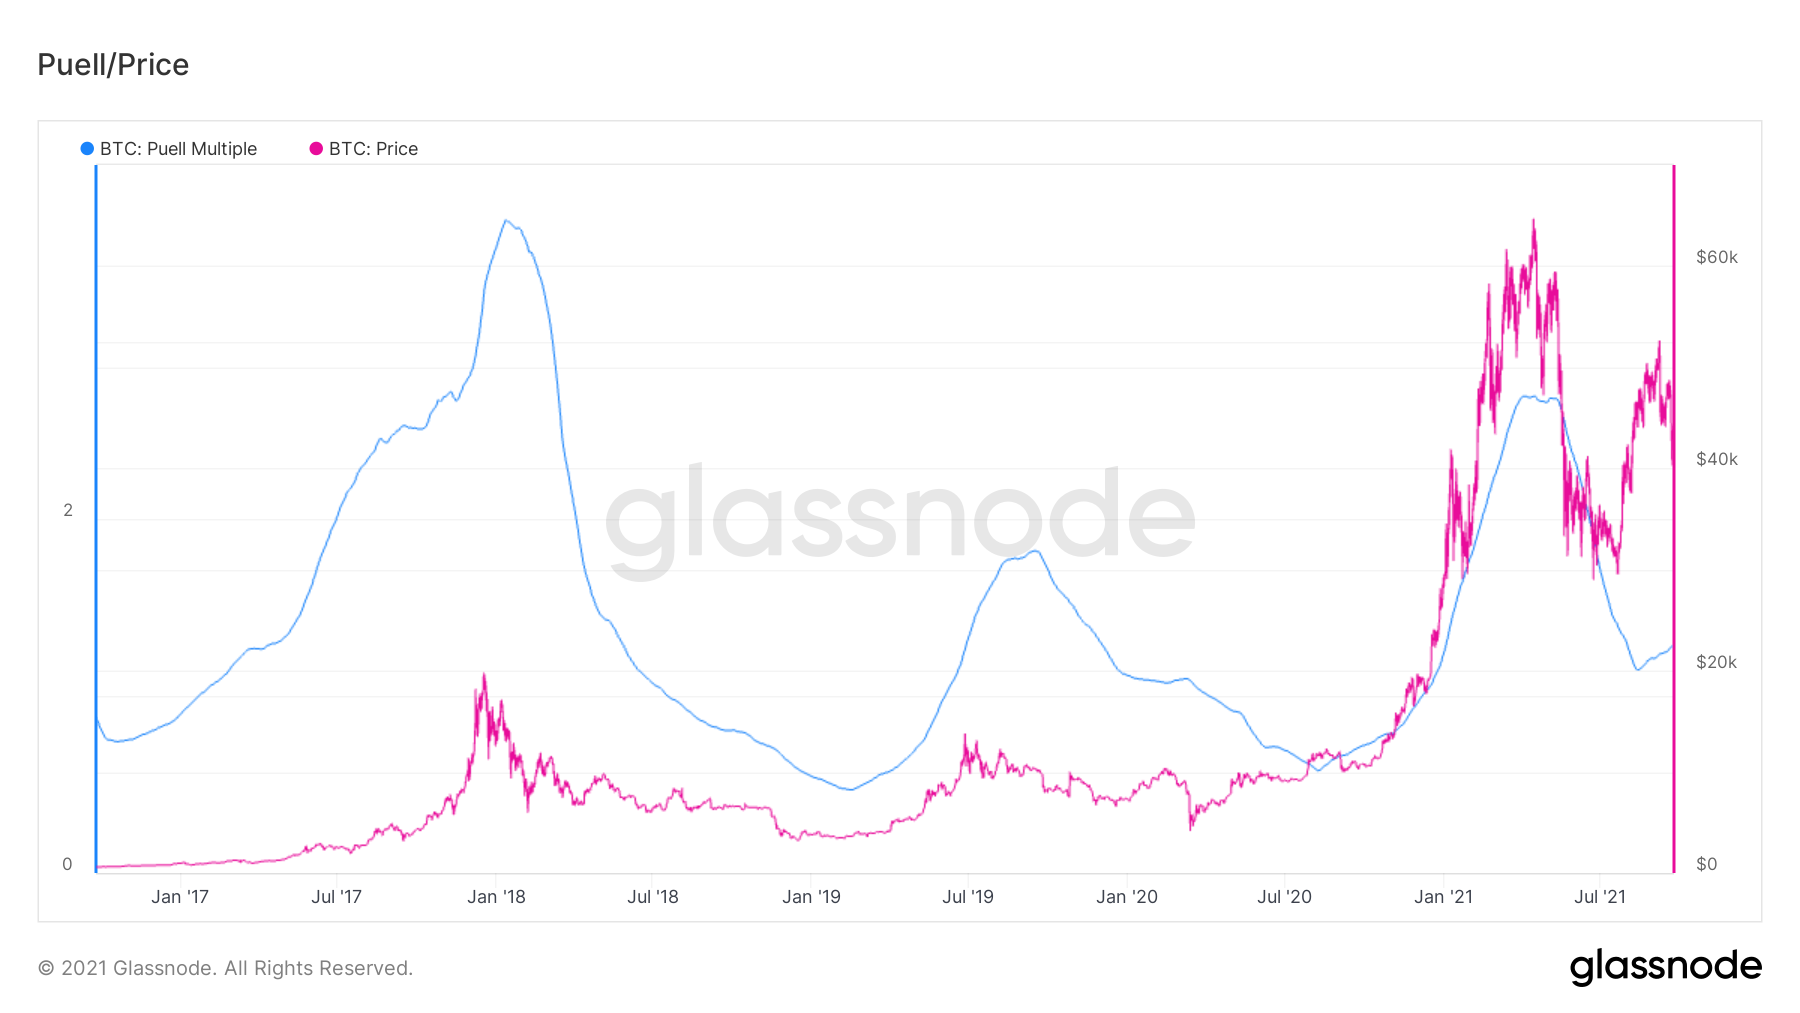
Going even further out to 10 years of data, we can see the longer-term relationship between price and Puell. The price of Bitcoin tends to be lower when Puell is lower. This corresponds to lower profitability for the miners and signals a potential price recession and a time for the opportunity to increase BTC positions prior to expansive growth. Price action that was observed as recently as this spring supports this assertion and is also illustrated in mid-2019 and early 2018. Going back further reveals similar behaviors as miners accumulate during periods of lower profitability followed by strong sell-offs into the rising price.
Are we ready for a bull run as illiquid assets grow?
The total amount of Bitcoin in circulation is currently under 20 million BTC. Bitcoin can be classified into three main categories when it comes to liquidity: illiquid, liquid, and highly liquid. The first, illiquid, describes BTC assets that are being HODLed long-term in cold wallets or lost forever due to access problems. These assets are essentially completely unavailable to the market with little chance of being “spent” in the near term. Liquid describes bitcoin that is being held by entities like exchanges, which represents the smallest amount of the total circulating supply. Highly liquid BTC is the Bitcoin that is being constantly traded and transacted on a daily basis.
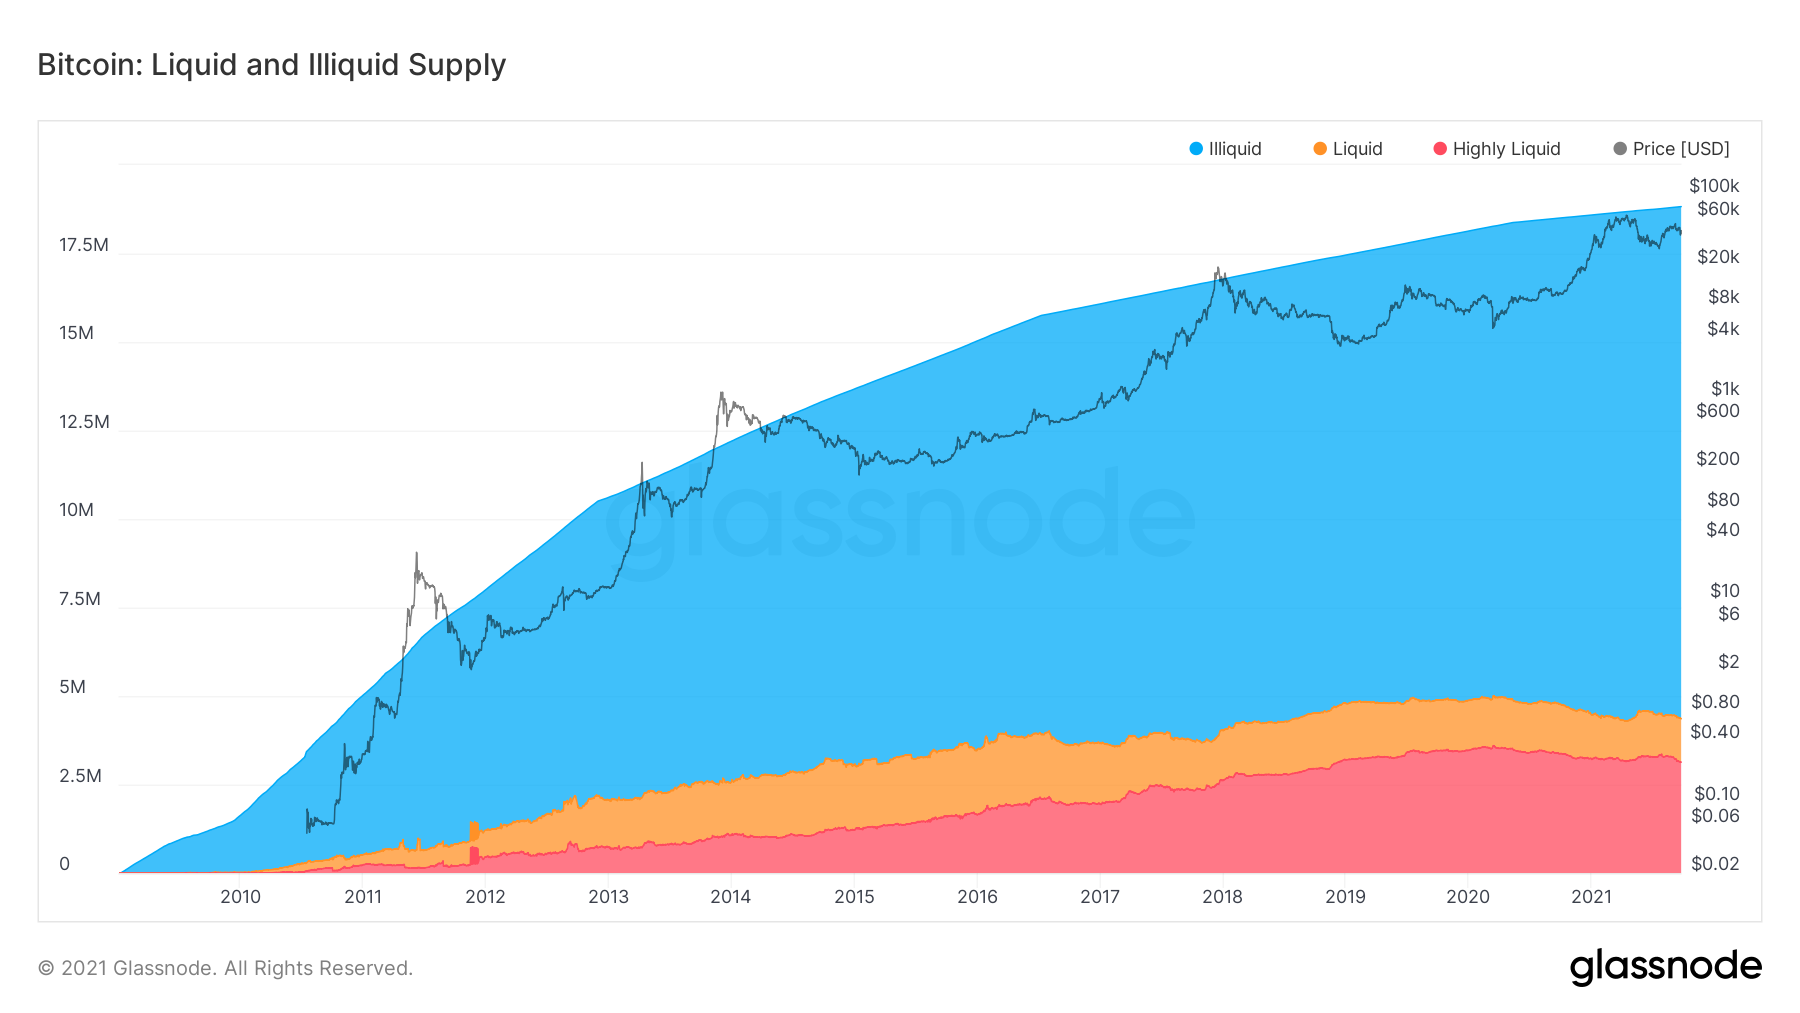
We can clearly see a trend of illiquid supply growing over time which indicates a strong and growing HODL behavior in the market. Based on these figures, nearly 77% of the total supply of BTC (18.8m) is considered illiquid.
Current levels with the price at ~42k on 9/23/2021:
- Total Supply: 18.8m
- Illiquid: 14.4m
- Liquid: 1.3m
- Highly Liquid: 3.1m
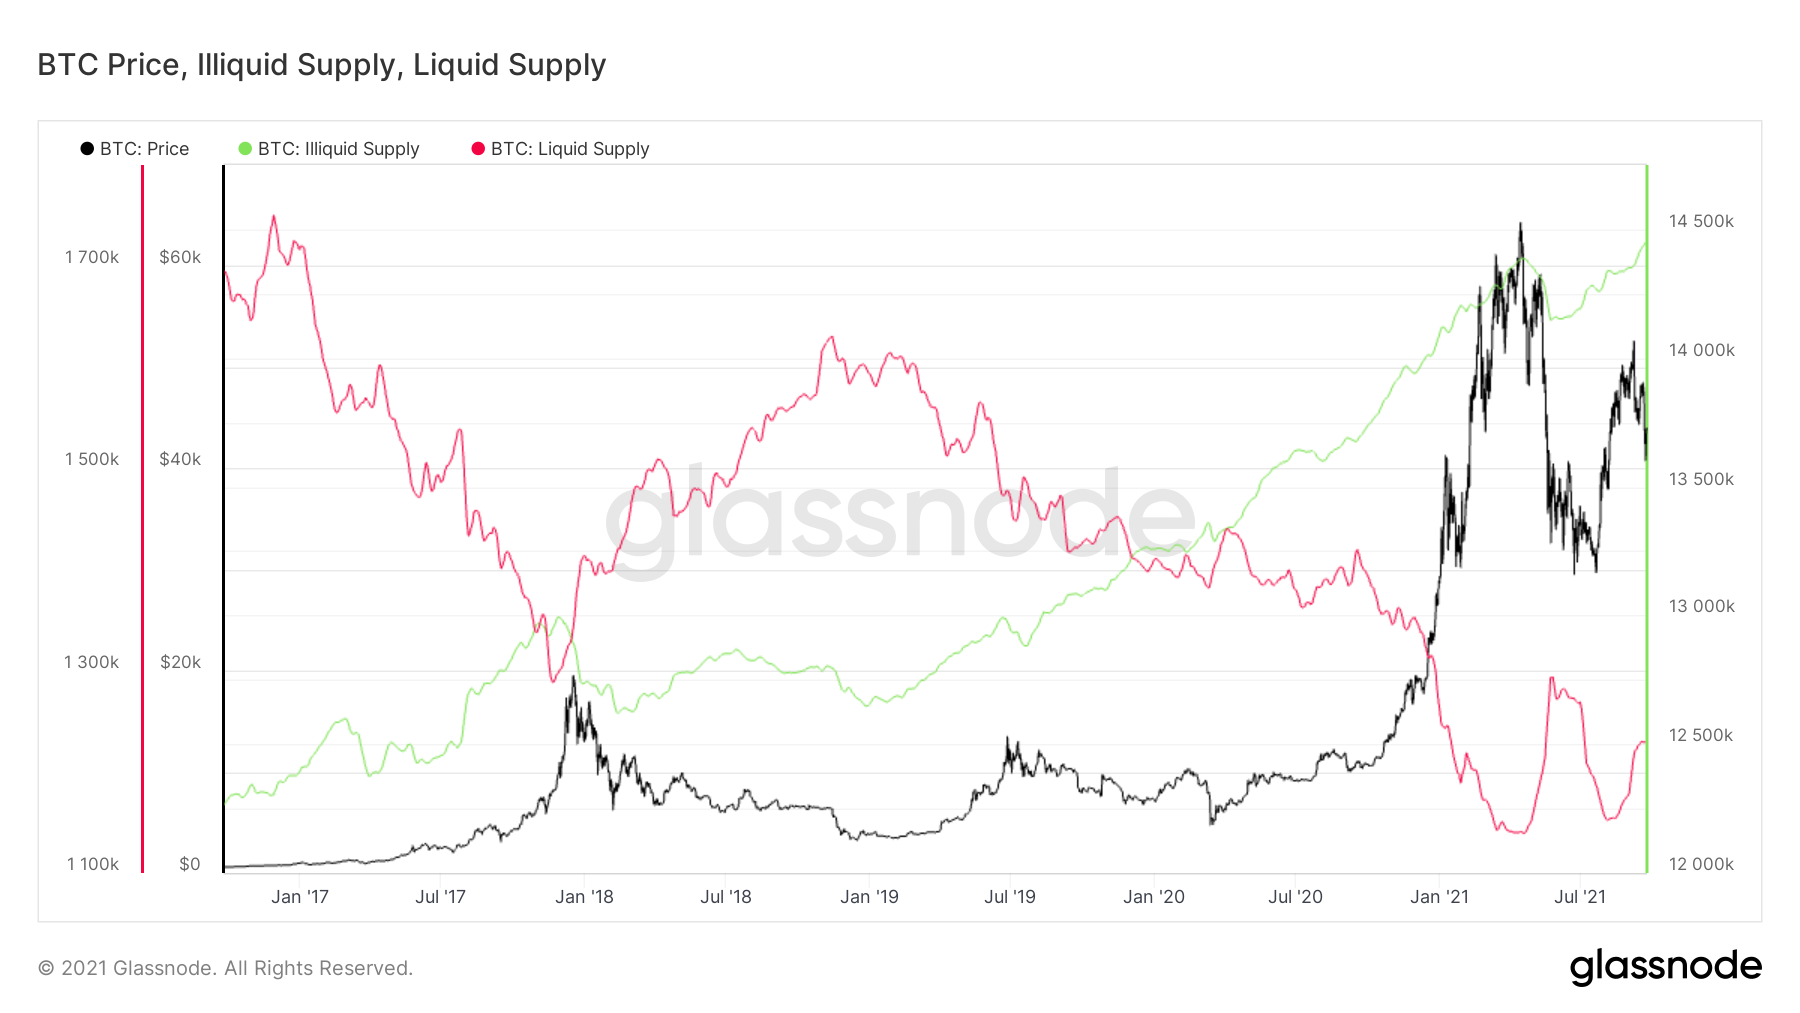
Even more interesting are the linear long-term plots of this data which shows clear trends in regards to the illiquid vs liquid relationship. The general observation is crystal clear: liquid supply is diminishing while illiquid supply is growing.
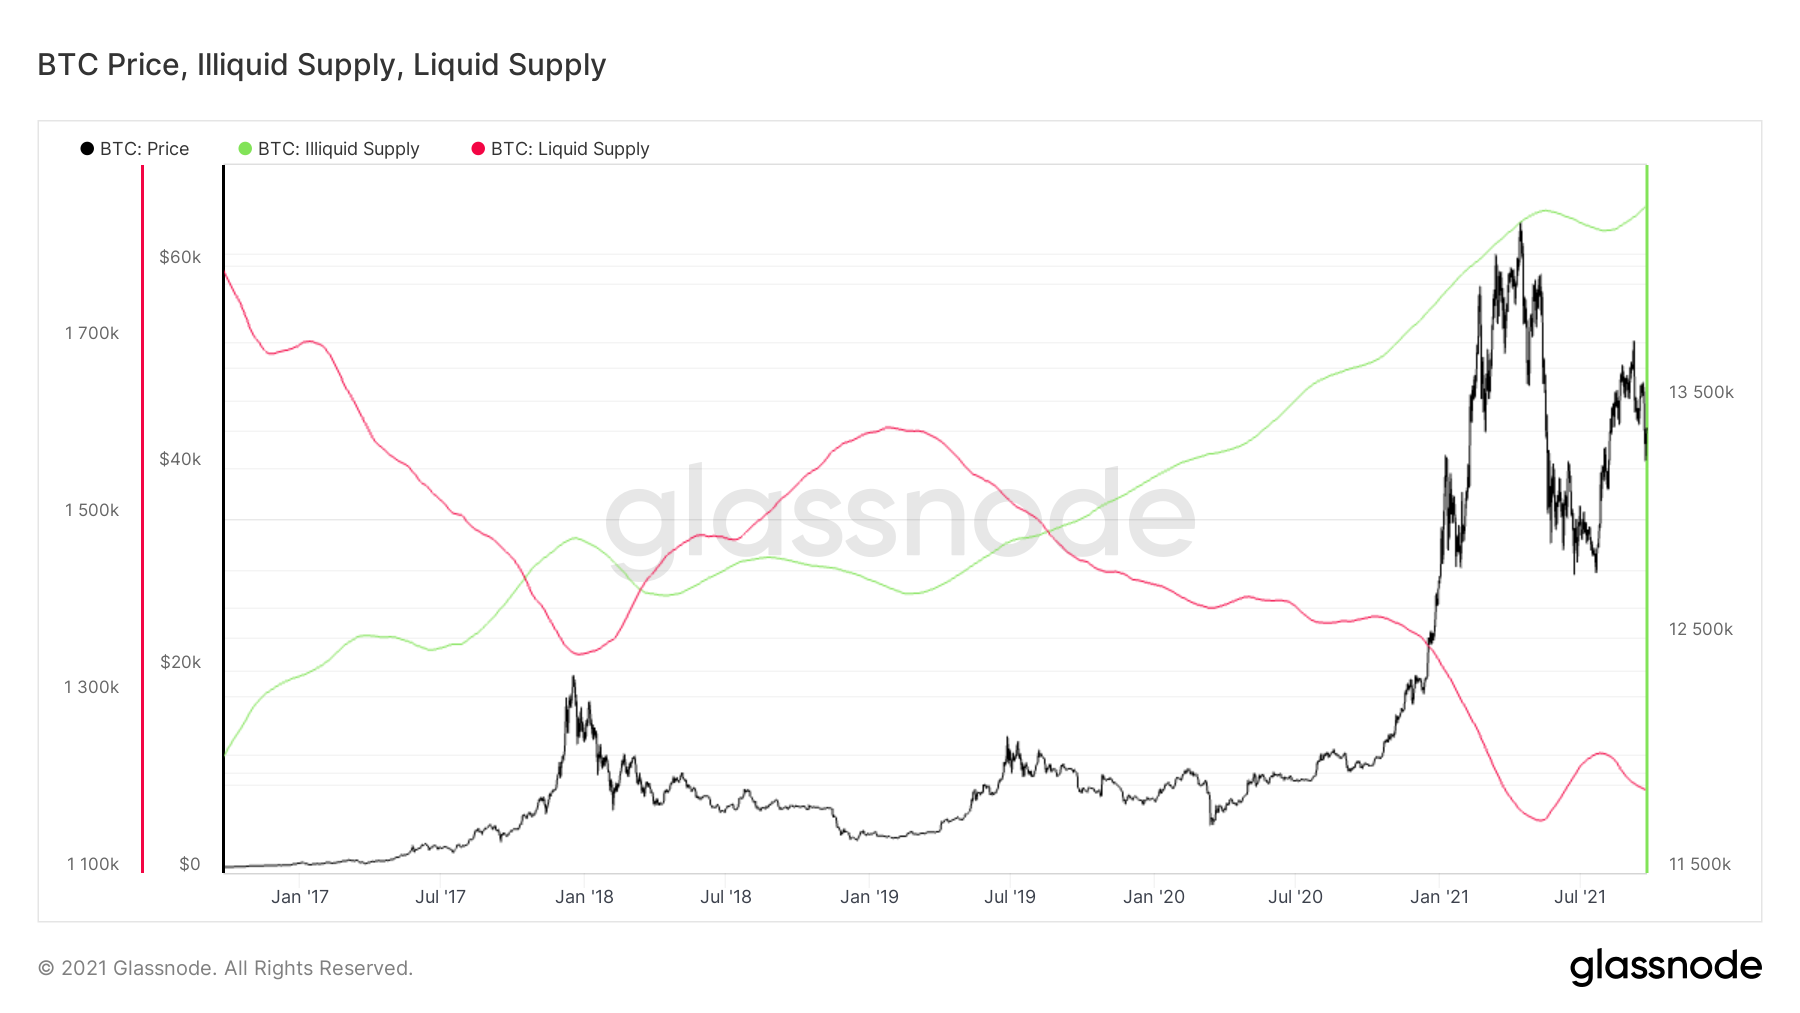
Smoothing out the data clarifies this trend, and the assumption can be made that as the accessible supply of BTC (liquid supply) decreases and becomes illiquid, the price of Bitcoin should react by rising in the face of greater demand and usage. Especially since the trend appears to support the idea that HODLing, if tied to illiquid supply, will increase, reducing the accessible amount and driving price up due to increased demand.
Conclusion: BTC Price in a slight downward trend with a potential upside in coming weeks.
It seems obvious that those who control the supply of Bitcoin, control the price. In this case, the miners seem to be firmly in the driver’s seat. When looking at the Puell Multiple and factoring in recent profit-taking, the potential for price growth is possible. Whether or not it is eminent is unclear since in the past even when Puell was low, the price of BTC stabilized or dropped further as profitability dropped.
Next week
The forecast for BTC in week #39 is that prices will stabilize and hover in the low to mid-40s with possible modest gains or losses in price over the week prior to any considerable price action.
Later this year
Looking further into the later weeks of 2021, the expectation that prices will begin to climb with the potential to reach beyond ATHs of early 2021 into the high 50s and low 60s looks promising.
Featured Photo by Bermix Studio on Unsplash